Did you know that from iPhones 5s and iOS 8 (minimal) the Apple Health App automatically collect your steps, walking, running and flights climbed data? This post will show you how […]
Author: jletteboer
Visualizing with D3 JavaScript Network Graphs from R
Hi all, I want to visualize some of my courses I’ve followed by year. I have found D3 JavaScript Network Graphs from R with some nice and cool visualizations. In […]
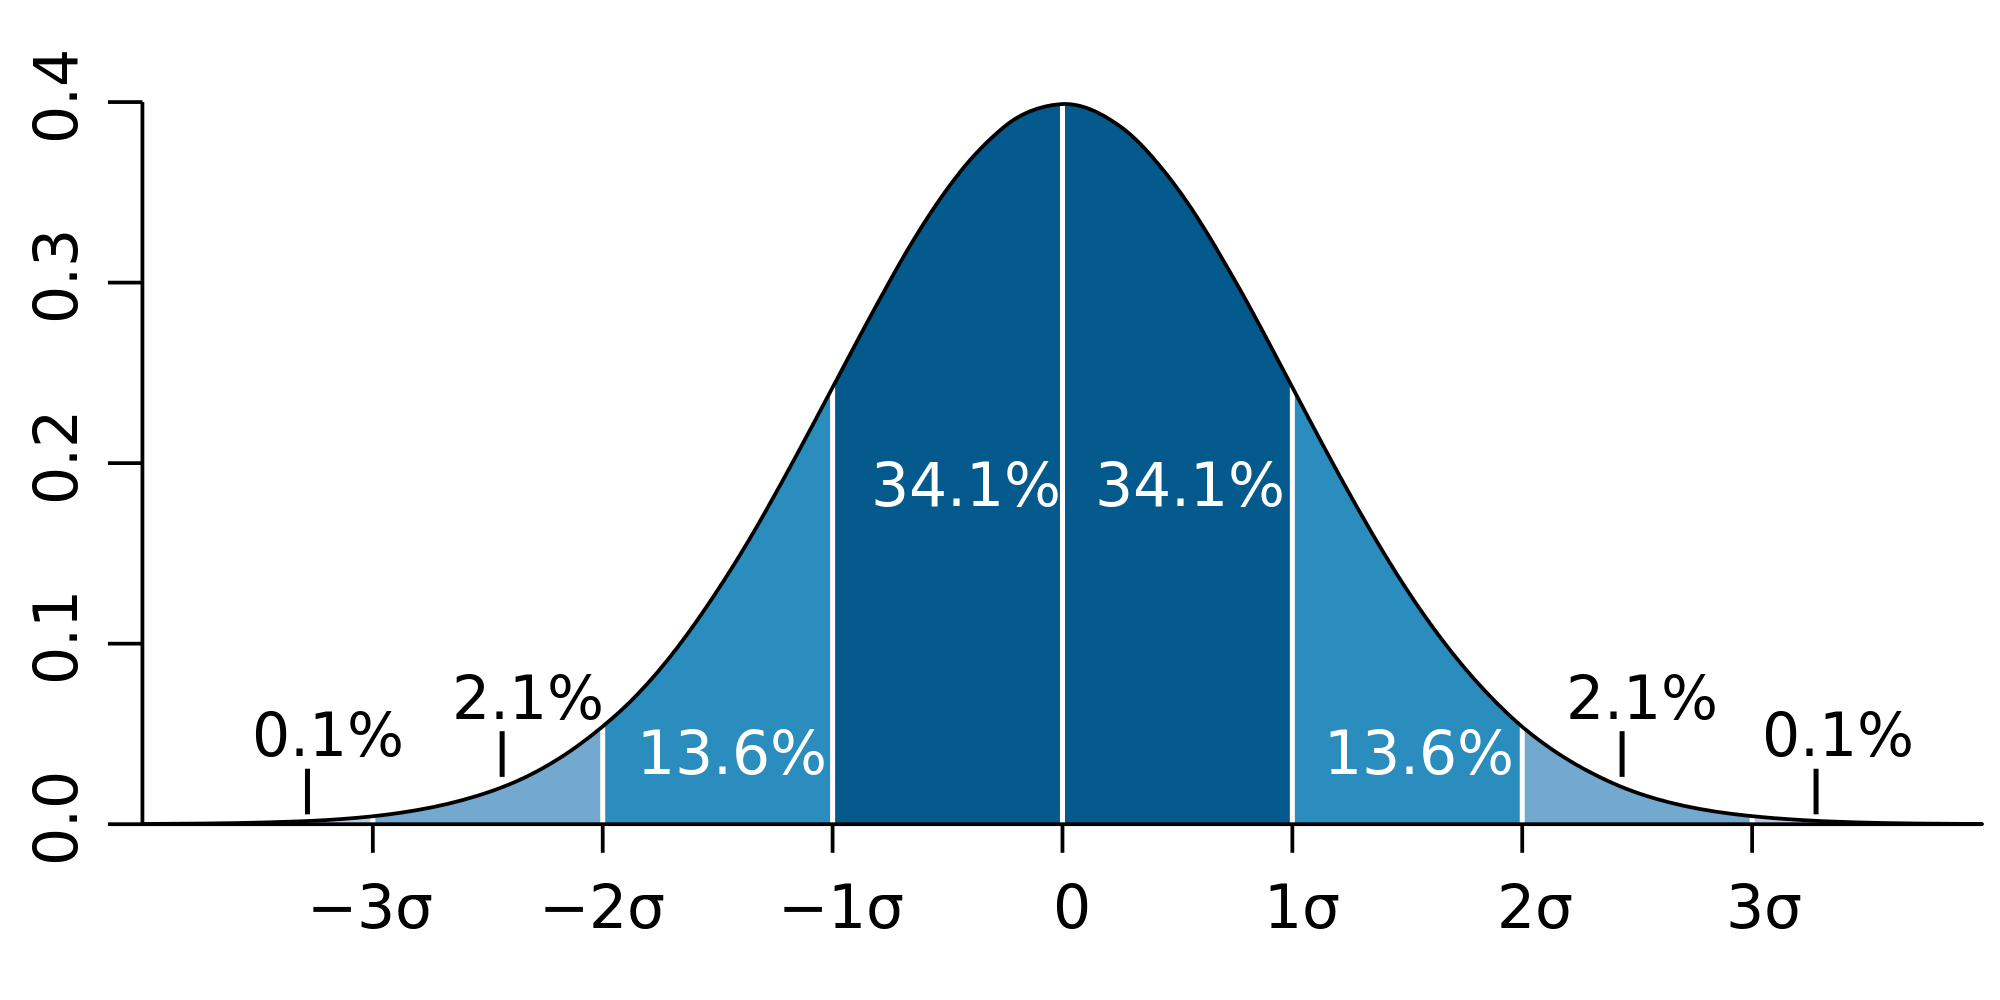
Descriptive Statistics Final Project with Python & R
Text Mining with R on Vikings episode scripts
Synopsis I'm a hugh fan of the TV show Vikings. I thought it would be cool to mine the tv shows scripts to figure out which terms are the most […]
Setting up a DataScience Server
After installing multiple software, servers etc. on my laptop it was overloaded with different tools and running services. When I get a new laptop or it will crash I can start […]
Upload plots as PNG file to your wordpress
Synopsis Note! This post is a addition to Create blog posts from RStudio to WordPress About a week ago I tried to add my blog to R-Bloggers. I thought everything […]
Visualizing San Francisco Crime Classification with Tableau
Playing with Tableau and the San Francisco Crime Classification training dataset of Kaggle. An interactive Tableau version can found on this link..
Titanic – Machine Learning from Disaster (Part 1)
Synopsis In the challenge Titanic – Machine Learning from Disaster from Kaggle, you need to predict of what kind of people were likely to survive the disaster or did not. […]
Create blog posts from RStudio to WordPress
In a couple of courses I’ve used RPubs and GitHub for publishing my R code and work. As I have a own website with WordPress I want to blog from R to […]
Won Mastery Level course license
On 8 October Data-Mania started it’s opening day for the course R Programming for Data Science!! They also started a Course GIVEAWAY of a Mastery Level course license. Good for 12 […]