Text Mining with R on Vikings episode scripts

Synopsis
I’m a hugh fan of the TV show Vikings. I thought it would be cool to mine the tv shows scripts to figure out which terms are the most used in the show and what the correlations are between the most frequent terms and episodes.
Who do not know this serie here is some information of Vikings
Getting the data
Before we can start we need to get the data. I have found a website with a lots of tv and movie scripts. All the scripts are embed in HTML code that we must extract. R has a package rvest for this and we will use it to get our data.
Rvest is a library that easily harvest (Scrape) web pages rvest.
|
1 2 |
# Loading the required libraries library(rvest) |
|
1 2 |
## Loading required package: xml2 |
The script is written as we can harvest another tv show if we want only with setting it to another tv show.
Setting our variables, such as, which tv show we want, download directory, base urls etc.
|
1 2 3 4 5 6 7 8 9 10 11 |
# Which tv show, if you want another show, first check on the website which tv show url is used. tvshow <- "vikings" # Creating download directory and change to it directory = paste("~/Data Analysis/files/", tvshow, sep="") dir.create(directory, recursive = TRUE, showWarnings = FALSE) setwd(directory) # Setting base url and complte url baseurl <- "http://www.springfieldspringfield.co.uk/" url <- paste(baseurl,"episode_scripts.php?tv-show=", tvshow, sep="") |
There are 4 seasons with 10 episodes each of Vikings, it do not want to scrape it piece by peice, so first we scrape all episode urls before we can downloding the scripts. Before that we need to explorer the websites source for which nodes to select.
Go to the urls you want to scrape, in my case this. In case of a Chrome browser right click the first epidose of season 1 and select inspect. You wil see the following:

As you can see after the tag <h3> the first href tag of s01e01 with the class class="season-episode-title". This class we need to select as our node.
|
1 2 3 4 5 6 7 8 |
# read the HTML page scrape_url <- read_html(url) # node selector s_selector <- ".season-episode-title" # scrape href nodes in .season-episode-title all_urls_season <- html_nodes(scrape_url, s_selector) %>% html_attr("href") |
Show some structure of the all_url_seasons.
|
1 |
str(all_urls_season) |
|
1 2 |
## chr [1:40] "view_episode_scripts.php?tv-show=vikings&episode=s01e01" ... |
|
1 |
head(all_urls_season) |
|
1 2 3 4 5 6 7 |
## [1] "view_episode_scripts.php?tv-show=vikings&episode=s01e01" ## [2] "view_episode_scripts.php?tv-show=vikings&episode=s01e02" ## [3] "view_episode_scripts.php?tv-show=vikings&episode=s01e03" ## [4] "view_episode_scripts.php?tv-show=vikings&episode=s01e04" ## [5] "view_episode_scripts.php?tv-show=vikings&episode=s01e05" ## [6] "view_episode_scripts.php?tv-show=vikings&episode=s01e06" |
|
1 |
tail(all_urls_season) |
|
1 2 3 4 5 6 7 |
## [1] "view_episode_scripts.php?tv-show=vikings&episode=s04e05" ## [2] "view_episode_scripts.php?tv-show=vikings&episode=s04e06" ## [3] "view_episode_scripts.php?tv-show=vikings&episode=s04e07" ## [4] "view_episode_scripts.php?tv-show=vikings&episode=s04e08" ## [5] "view_episode_scripts.php?tv-show=vikings&episode=s04e09" ## [6] "view_episode_scripts.php?tv-show=vikings&episode=s04e10" |
As we can see in the structure display we have 40 urls of the episodes. Now we have all variables and season urls, we can harvest the scripts and save them to seperate text files for doing our text mining.
|
1 2 3 4 5 6 7 8 9 10 11 12 13 14 15 16 17 |
# Loop through all season urls for (i in all_urls_season) { uri <- read_html(paste(baseurl, i, sep="/")) # same thing here first check which node we need to select, so forst do a inspect of the site script_selector <- ".scrolling-script-container" # scrape all script text to a variable text <- html_nodes(uri, script_selector) %>% html_text() # Get last five characters of all_urls_season as season for saving this to seperate text files substrRight <- function(x, n) { substr(x, nchar(x)-n+1, nchar(x)) } seasons <- substrRight(i, 5) # Write each script to a seperate text file write.csv(text, file = paste(directory, "/", tvshow, "_", seasons, ".txt", sep=""), row.names = FALSE) } |
Starting with Text Mining
Now that we have all Viking episode scripts we can do some text mining with the tm library.
|
1 2 |
# load library library(tm) |
|
1 2 |
## Loading required package: NLP |
|
1 2 3 4 |
# set filepath to scripts cname <- file.path(directory) # see if the filepath contains our scripts (docname <- dir(cname)) |
|
1 2 3 4 5 6 7 8 9 10 11 12 13 14 15 |
## [1] "vikings_01e01.txt" "vikings_01e02.txt" "vikings_01e03.txt" ## [4] "vikings_01e04.txt" "vikings_01e05.txt" "vikings_01e06.txt" ## [7] "vikings_01e07.txt" "vikings_01e08.txt" "vikings_01e09.txt" ## [10] "vikings_02e01.txt" "vikings_02e02.txt" "vikings_02e03.txt" ## [13] "vikings_02e04.txt" "vikings_02e05.txt" "vikings_02e06.txt" ## [16] "vikings_02e07.txt" "vikings_02e08.txt" "vikings_02e09.txt" ## [19] "vikings_02e10.txt" "vikings_03e01.txt" "vikings_03e02.txt" ## [22] "vikings_03e03.txt" "vikings_03e04.txt" "vikings_03e05.txt" ## [25] "vikings_03e06.txt" "vikings_03e07.txt" "vikings_03e08.txt" ## [28] "vikings_03e09.txt" "vikings_03e10.txt" "vikings_03e90.txt" ## [31] "vikings_04e01.txt" "vikings_04e02.txt" "vikings_04e03.txt" ## [34] "vikings_04e04.txt" "vikings_04e05.txt" "vikings_04e06.txt" ## [37] "vikings_04e07.txt" "vikings_04e08.txt" "vikings_04e09.txt" ## [40] "vikings_04e10.txt" |
|
1 2 3 4 |
# Crete a Corpus of the text files so we can do some analysis docs <- Corpus(DirSource(cname), readerControl = list(id=docname)) # Show summary of the Corpus, we have 40 document in our Corpus summary(docs) |
|
1 2 3 4 5 6 7 8 9 10 11 12 13 14 15 16 17 18 19 20 21 22 23 24 25 26 27 28 29 30 31 32 33 34 35 36 37 38 39 40 41 42 |
## Length Class Mode ## vikings_01e01.txt 2 PlainTextDocument list ## vikings_01e02.txt 2 PlainTextDocument list ## vikings_01e03.txt 2 PlainTextDocument list ## vikings_01e04.txt 2 PlainTextDocument list ## vikings_01e05.txt 2 PlainTextDocument list ## vikings_01e06.txt 2 PlainTextDocument list ## vikings_01e07.txt 2 PlainTextDocument list ## vikings_01e08.txt 2 PlainTextDocument list ## vikings_01e09.txt 2 PlainTextDocument list ## vikings_02e01.txt 2 PlainTextDocument list ## vikings_02e02.txt 2 PlainTextDocument list ## vikings_02e03.txt 2 PlainTextDocument list ## vikings_02e04.txt 2 PlainTextDocument list ## vikings_02e05.txt 2 PlainTextDocument list ## vikings_02e06.txt 2 PlainTextDocument list ## vikings_02e07.txt 2 PlainTextDocument list ## vikings_02e08.txt 2 PlainTextDocument list ## vikings_02e09.txt 2 PlainTextDocument list ## vikings_02e10.txt 2 PlainTextDocument list ## vikings_03e01.txt 2 PlainTextDocument list ## vikings_03e02.txt 2 PlainTextDocument list ## vikings_03e03.txt 2 PlainTextDocument list ## vikings_03e04.txt 2 PlainTextDocument list ## vikings_03e05.txt 2 PlainTextDocument list ## vikings_03e06.txt 2 PlainTextDocument list ## vikings_03e07.txt 2 PlainTextDocument list ## vikings_03e08.txt 2 PlainTextDocument list ## vikings_03e09.txt 2 PlainTextDocument list ## vikings_03e10.txt 2 PlainTextDocument list ## vikings_03e90.txt 2 PlainTextDocument list ## vikings_04e01.txt 2 PlainTextDocument list ## vikings_04e02.txt 2 PlainTextDocument list ## vikings_04e03.txt 2 PlainTextDocument list ## vikings_04e04.txt 2 PlainTextDocument list ## vikings_04e05.txt 2 PlainTextDocument list ## vikings_04e06.txt 2 PlainTextDocument list ## vikings_04e07.txt 2 PlainTextDocument list ## vikings_04e08.txt 2 PlainTextDocument list ## vikings_04e09.txt 2 PlainTextDocument list ## vikings_04e10.txt 2 PlainTextDocument list |
|
1 2 |
# Inspect the first document, it has 12958 characters inspect(docs[1]) |
|
1 2 3 4 5 6 7 8 9 |
## <<VCorpus>> ## Metadata: corpus specific: 0, document level (indexed): 0 ## Content: documents: 1 ## ## [[1]] ## <<PlainTextDocument>> ## Metadata: 7 ## Content: chars: 12943 |
There is a lot of information in the script we do not need and is not useful for text mining. We need to clean it up. We remove all numbers, convert text to lowercase, remove punctuation and stopwords, in this case english.
|
1 2 3 4 |
docs <- tm_map(docs, tolower) docs <- tm_map(docs, removePunctuation) docs <- tm_map(docs, removeNumbers) docs <- tm_map(docs, removeWords, stopwords("english")) |
Now we will perform stemming, a stem is a form to which affixes can be attached. An example of this is wait, waits, waited, waiting, all of them are common to wait.
|
1 2 |
library(SnowballC) docs <- tm_map(docs, stemDocument) |
We have removed a lot of characters which resulted in a lot of whitespaces, we remove this also.
|
1 |
docs <- tm_map(docs, stripWhitespace) |
Let’s have a look to our first document.
|
1 |
inspect(docs[1]) |
|
1 2 3 4 5 6 7 8 9 10 11 12 |
## <<VCorpus>> ## Metadata: corpus specific: 0, document level (indexed): 0 ## Content: documents: 1 ## ## [[1]] ## [1] x ## [2] ## [3] ## [4] ## [5] ## [6] ragnar odin ragnar give give heart love voice sing night wake ill see tomorrow brings voice sing come lets go home watch two im taking bjorn thing tomorrow yet hes old enough hes twelve years old take next year next year soon enough hell need silk ribbon lagertha youre handsome boy funny ears though dont sleep lots women kattegat can without days another way saying love huh always dream dreamt feeding blood pudding mean means youre giving heart get dog boy frodi come boy earl will deal criminal fences well discuss summer raids will go earl decides owns ships hell send us east always baltic lands want know west cities gods see im satisfied odin gave eye acquire knowledge give far will earl haraldson let good like nice tight three one two three good gyda gyda feed goats go know youre alone men gone youre thirsty will give drink youre hungry will feed otherwise must go weve satisfied needs dont want kill woman couldnt kill tried hundred years went confess love set upon bear enormous hound guarded home killed bear spear managed strangle hound bare hands gained hand marriage tell story just ready receive arm ring become man yes man fights looks family thats right look family mean look us say wasnt big decision make may change many things now go sleep big day tomorrow bjorn brother frey gods youve grown hello rollo thing youre real man now come lets get drink looking little pale bjorn dont go lie think earl going send us year bastards east poor know thats sail west ive heard tales rollo great towns cities treasures hordes gold silver new god ive heard stories mean cant sail across open ocean believe theres way go west something will change everything now just listen back met someone wanderer told possible go west open sea using sunboard needs sit water another wanderer now tell ragnar thisthis wanderer ever sailed west just get water now candle sun every day sun rises sky noon see shadow shortens noon shortest tells far south travelled didnt just tell listen mark circle around pointer shadow shortest noon next day sea place board back water around noon watch shadow shadow touches circle course remains true yes passes outside circle like drifted must steer south yes never reaches circle far south must steer north thats keep noon shadow circle course will true west sun can board help find way using follow outside call sunstone see sun now go west come come silence silence olaf anwend pleaded guilty charge stealing tomorrow will run gauntlet stones turf punishment yes lord thank lord let known fine paid anyone fails throw something bring next accused murderer eric trygvasson accused murder sigvald strut january wasnt murder lord killed selfdefense liar first person met afterwards law obliges fact passed several houses reported thought relatives dead man might living law allows pass two houses circumstances murdered brother cold blood true argued disputed land wanted land youre liar coward says im coward im coward silence normal procedures followed killing atoned compensating victims family murder dishonorable deed amongst people carried secret unacknowledged likely give rise series revenge killings involve family lord knew land knew claim enough ask look accused think guilty raise arms decision must unanimous eric trygvasson found guilty murder yes justice wish die beheading lord wish granted shall executed tomorrow will shall feast talk summer raids yeah yeah smiling father wants die well without fear atone sins must watch sake hope reaching valhalla feed pigs curse may never enter valhalla may never feast gods done someone told wanted land knew trygvasson best claim refused sell hear boy things done around olaf son ingolf bjorn son ragnar may accept gift salt earth belong land sea arm rings bind loyalty lord chieftain oath swear rings must honored kept understand swear yes lord freely give fealty lord chieftain yes lord good may put arm rings come wooooo let us feast lord want feast also want know will raiding summer cant wait ragnar tell us want know right know well will raid east eastlands russia every year go places alternative choose yes yes choice yes heard rumors stories travel west will somehow reach land rich plentiful tell will risk ships reputation deluded fantasy ships pay go tell go now thats end matter lets feast let see fine ring ragnar lothbrok earl haraldson wants speak private stay uncle ragnar lothbrok sit hungry yes lord want feast hall want sail ships anything else want keep talking west know land great riches cant sure believe dont care believe insulted first time believe will last told go farmer content lot farms great demand many people like possess land understand im saying understand dont ever stick nose face dont trust watch sons said youd found going now im tired talk gods dont come im waiting sit want want know gods store boy im interested gods desire great future see can withdraw goodwill time great future must challenge law must convince gods alter runes work favor laws men far workings shapings gods take laws men hands answer already answer dont well go ask gods afraid wait outside right havent helped ancient one perhaps asked wrong questions someone special visit name floki floki like loki god yes different different hes god didnt come thing hes shy floki son bjorn hello well thank sir let see fathers eyes unfortunately unfortunately means will like therefore will want better will hate can tell just looking face trees can tell trees will make best planks just looking can look inside tree floki boatbuilder among things one inside tree two almost perfect planks will bend curve like womans body thighs back split tree will find can see think im joking joke many things son ragnar never shipbuilding imagine ships just dead things boat will lighter carry bigger sail construction different built strong central plank two strakes nailed directly onto knees frame ones look cleated lashed onto frames can move relation means boat wont butt waves like goat move like ripple hull deeper will men set oars will cut sheerstrakes ports can closed boat sea think handle long sea voyages thats im building will strong enough wont know try anchor left last summers raids dont worry well soon rich dwarves missed anything happen away miss ached love longing belly empty laughter want want make laugh dont want laugh now want ride like bull like wild bull hello young bjorn hello rollo parents sex well guess well wait gyda mother teaching use shield yes know use shield mother famous shieldmaiden famous shieldmaiden come children bed lets leave men im man ring let stay awhile bed say good night good night children good night hey tell news boat nearly ready wont go command wont go unless equal brothers will always equal must find crew many men will go wishes haraldson many will afraid may even go betray us must go piss yesterday girl town thank goodlooking girl shouted pleasure didnt see face saw lagertha dont talk like think time thats bad dont insult shieldmaiden never insult youre great warrior perhaps great man saw something see sign made certain right thing good night brother set sail floki sail shell sink shouldnt pretended build boat beyond humble capabilities ill set sail floki im sorry ragnar ive wasted money joke shut man ha now runs cool keel beautiful didnt believe told now ragnar lothbrok |
I have hash it because wordpress has problems with editing the post.
We are ready with preprosessing the data and turn the document back as plain text documents.
|
1 |
docs <- tm_map(docs, PlainTextDocument) |
Create a Term Document Matrix of our documents. Which reflects the number of times each term in the corpus is found in each of the documents. And add some readable columnnmes.
|
1 2 3 4 5 6 7 8 9 |
# Create a tdm tdm <- TermDocumentMatrix(docs) # Add readable columnnames, in our case the document filename docname <- gsub("vikings_", "",docname) docname <- gsub(".txt", "",docname) docname <- paste("s",docname, sep="") colnames(tdm) <- docname # Show and inspect the tdm tdm |
|
1 2 3 4 5 6 |
## <<TermDocumentMatrix (terms: 5608, documents: 40)>> ## Non-/sparse entries: 22220/202100 ## Sparsity : 90% ## Maximal term length: 17 ## Weighting : term frequency (tf) |
|
1 |
inspect(tdm[1:10,1:6]) |
|
1 2 3 4 5 6 7 8 9 10 11 12 13 14 15 16 17 18 19 |
## <<TermDocumentMatrix (terms: 10, documents: 6)>> ## Non-/sparse entries: 2/58 ## Sparsity : 97% ## Maximal term length: 10 ## Weighting : term frequency (tf) ## ## Docs ## Terms s01e01 s01e02 s01e03 s01e04 s01e05 s01e06 ## abandon 0 0 0 0 0 0 ## abandoned 0 0 0 0 0 0 ## abandoning 0 0 0 0 0 0 ## abandons 0 0 0 0 0 0 ## abbot 0 0 0 1 0 0 ## abdication 0 0 0 0 0 0 ## abed 0 0 0 0 0 0 ## abide 0 0 0 0 0 0 ## abl 0 0 0 0 0 0 ## able 0 0 0 0 0 1 |
Do the same for a Document Term Matrix (this is a transpose of a tdm)
|
1 2 3 |
dtm <- DocumentTermMatrix(docs) rownames(dtm) <- docname dtm |
|
1 2 3 4 5 6 |
## <<DocumentTermMatrix (documents: 40, terms: 5608)>> ## Non-/sparse entries: 22220/202100 ## Sparsity : 90% ## Maximal term length: 17 ## Weighting : term frequency (tf) |
|
1 |
inspect(dtm[1:10,1:6]) |
|
1 2 3 4 5 6 7 8 9 10 11 12 13 14 15 16 17 18 19 |
## <<DocumentTermMatrix (documents: 10, terms: 6)>> ## Non-/sparse entries: 2/58 ## Sparsity : 97% ## Maximal term length: 10 ## Weighting : term frequency (tf) ## ## Terms ## Docs abandon abandoned abandoning abandons abbot abdication ## s01e01 0 0 0 0 0 0 ## s01e02 0 0 0 0 0 0 ## s01e03 0 0 0 0 0 0 ## s01e04 0 0 0 0 1 0 ## s01e05 0 0 0 0 0 0 ## s01e06 0 0 0 0 0 0 ## s01e07 0 0 0 0 0 0 ## s01e08 0 0 0 0 0 0 ## s01e09 0 0 0 0 0 0 ## s02e01 1 0 0 0 0 0 |
Now we have done that we can ask questions about, what are de most frequently terms in the scripts and what are the associations between terms.
Term frequency
Let have a look of the most frequently terms first and show the top 20.
|
1 2 |
freq <- sort(colSums(as.matrix(dtm)), decreasing=TRUE) head(freq,20) |
|
1 2 3 4 5 |
## will ragnar dont know want can come man now king ## 806 467 387 373 354 342 335 300 290 264 ## see gods yes like must one father well god son ## 256 247 245 237 231 231 221 193 191 187 |
Plotting the terms frequencies
Add is to a data frame so we can plot it and show the top 20.
|
1 2 |
tf <- data.frame(term=names(freq), freq=freq) head(tf,20) |
|
1 2 3 4 5 6 7 8 9 10 11 12 13 14 15 16 17 18 19 20 21 22 |
## term freq ## will will 806 ## ragnar ragnar 467 ## dont dont 387 ## know know 373 ## want want 354 ## can can 342 ## come come 335 ## man man 300 ## now now 290 ## king king 264 ## see see 256 ## gods gods 247 ## yes yes 245 ## like like 237 ## must must 231 ## one one 231 ## father father 221 ## well well 193 ## god god 191 ## son son 187 |
Let’s plot it.
|
1 2 3 |
# descending sort of teh tf by freq tf$term <- factor(tf$term, levels = tf$term[order(-tf$freq)]) library(ggplot2) |
|
1 2 3 4 5 6 7 |
## ## Attaching package: 'ggplot2' ## ## The following object is masked from 'package:NLP': ## ## annotate |
|
1 2 3 4 |
p <- ggplot(subset(tf, freq>200), aes(term, freq)) p <- p + geom_bar(stat="identity") p <- p + theme(axis.text.x=element_text(angle=45, hjust=1)) p |

The most frequent term is will, after that is the main actor ragnar.
Further Analysis
As we can see in our first look at the tdm, we have a lot op sparse terms in our documents (90%). That is a lot, lets remove these.
|
1 2 |
tdm.common = removeSparseTerms(tdm, sparse = 0.1) tdm |
|
1 2 3 4 5 6 |
## <<TermDocumentMatrix (terms: 5608, documents: 40)>> ## Non-/sparse entries: 22220/202100 ## Sparsity : 90% ## Maximal term length: 17 ## Weighting : term frequency (tf) |
|
1 |
tdm.common |
|
1 2 3 4 5 6 |
## <<TermDocumentMatrix (terms: 36, documents: 40)>> ## Non-/sparse entries: 1391/49 ## Sparsity : 3% ## Maximal term length: 6 ## Weighting : term frequency (tf) |
That is a 87% less sparsity. See how many terms we had and now have.
|
1 |
dim(tdm) |
|
1 2 |
## [1] 5608 40 |
|
1 |
dim(tdm.common) |
|
1 2 |
## [1] 36 40 |
Hmm from 5608 terms to only 36 terms, we inspect the first 10 terms of the first 6 documents.
|
1 |
inspect(tdm.common[1:10,1:6]) |
|
1 2 3 4 5 6 7 8 9 10 11 12 13 14 15 16 17 18 19 |
## <<TermDocumentMatrix (terms: 10, documents: 6)>> ## Non-/sparse entries: 59/1 ## Sparsity : 2% ## Maximal term length: 6 ## Weighting : term frequency (tf) ## ## Docs ## Terms s01e01 s01e02 s01e03 s01e04 s01e05 s01e06 ## also 1 1 1 0 2 4 ## away 1 2 4 4 1 2 ## can 9 7 6 5 8 7 ## come 9 10 12 5 8 9 ## dont 12 14 11 13 12 10 ## father 1 4 4 6 12 3 ## gods 9 6 3 9 9 4 ## good 7 8 3 3 3 2 ## great 7 2 5 4 3 2 ## just 7 7 6 6 3 2 |
Let visualize these most common terms in a heatmap with ggplot. As ggplot works with a matrix we need to convert the tdm.comon to a matrix because the tdm is a spare matrix.
|
1 2 |
tdm.dense <- as.matrix(tdm.common) dim(tdm.dense) |
|
1 2 |
## [1] 36 40 |
We need the data as a normal matrix in order to produce the visualisation.
|
1 2 3 |
library(reshape2) tdm.dense.m <- melt(tdm.dense, value.name = "count") head(tdm.dense.m) |
|
1 2 3 4 5 6 7 8 |
## Terms Docs count ## 1 also s01e01 1 ## 2 away s01e01 1 ## 3 can s01e01 9 ## 4 come s01e01 9 ## 5 dont s01e01 12 ## 6 father s01e01 1 |
Make the heatmap visualization.
|
1 2 3 4 5 6 7 |
library(ggplot2) ggplot(tdm.dense.m, aes(x = Docs, y = Terms, fill = log10(count))) + geom_tile(colour = "white") + scale_fill_gradient(high="steelblue" , low="white")+ ylab("") + theme(panel.background = element_blank()) + theme(axis.text.x = element_text(angle = 90, hjust = 1, vjust = 0.5)) |
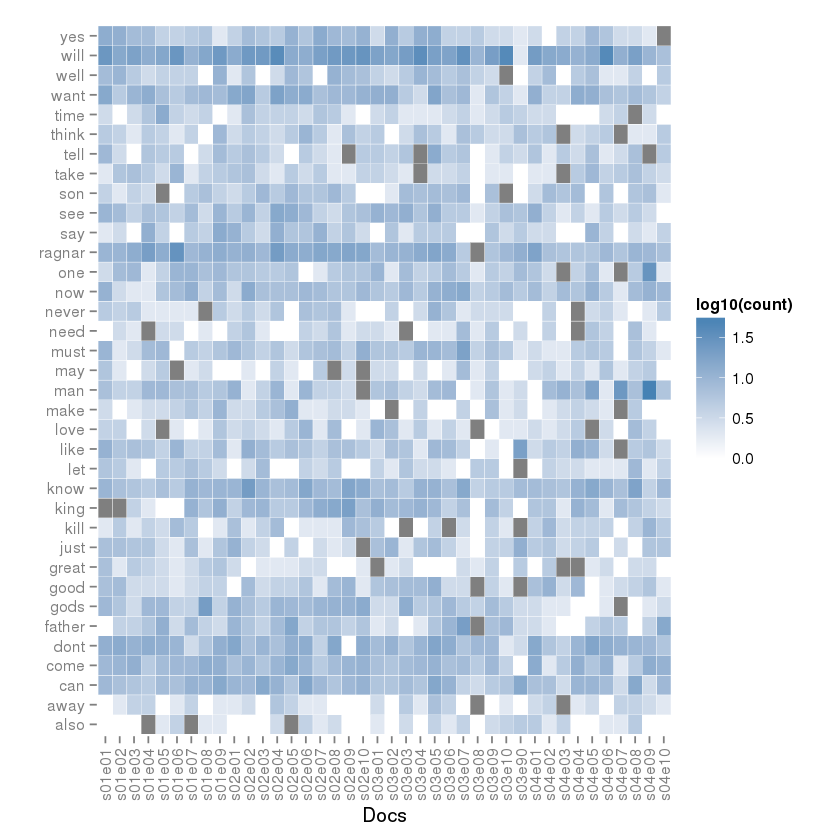
Okay what have we here? Now we can check which common terms are used in which season and episode of Vikings. The term will is common used in the most episodes excepts in s03e90. That’s a strange episode, isn’t it? (I’ve look that up, it no realy an episode it’s a documentary of Vikings 🙂 )
Now we plot a correlogram of the episodes.
Note: Correlogram is a graph of correlation matrix. It is very useful to highlight the most correlated variables in a data table. In this plot, correlation coefficients is colored according to the value. Correlation matrix can be also reordered according to the degree of association between variables.
|
1 2 3 |
corr <- cor(tdm.dense) library(corrplot) corrplot(corr, method = "circle", type = "upper", tl.col="black", tl.cex=0.7) |

Transpose the tdm.dense so we can plot a correlogram of the terms.
|
1 2 3 |
tdm.dense.t <- t(tdm.dense) corr.t <- cor(tdm.dense.t) corrplot(corr.t,method = "circle", type = "upper", tl.col="black", tl.cex=0.7) |

Well we can do a lot more analysis, mining and visualisations, this is it for now.

I’m creative, imaginative, free-thinking, daydreamer and strategic who needs freedom, peace and space to brainstorm and to fantasize about new and surprising solutions. Generates ideas and solves difficult problems, sees all options, judges accurately and wants to get to the bottom of things.
Interested in Data Science, Data Analytics, Running, Crossfit, Obstacle Running and Coffee.


3 comments on “Text Mining with R on Vikings episode scripts”
Comments are closed.